
CEADs Launches New Official Website: Building an Open, Visualized Global Carbon Emissions Data Service Platform
Recently, the new official website of the Carbon Emission Accounts and Datasets (CEADs) was officially launched. This revision systematically upgrades four major sections: data visualization, brand events, research progress, and team members. It further improves CEADs capacity for open data sharing, academic services, and platform presentation, providing more intuitive, convenient, and systematic data support for global carbon emissions research, climate policy analysis, and low-carbon transition practice.
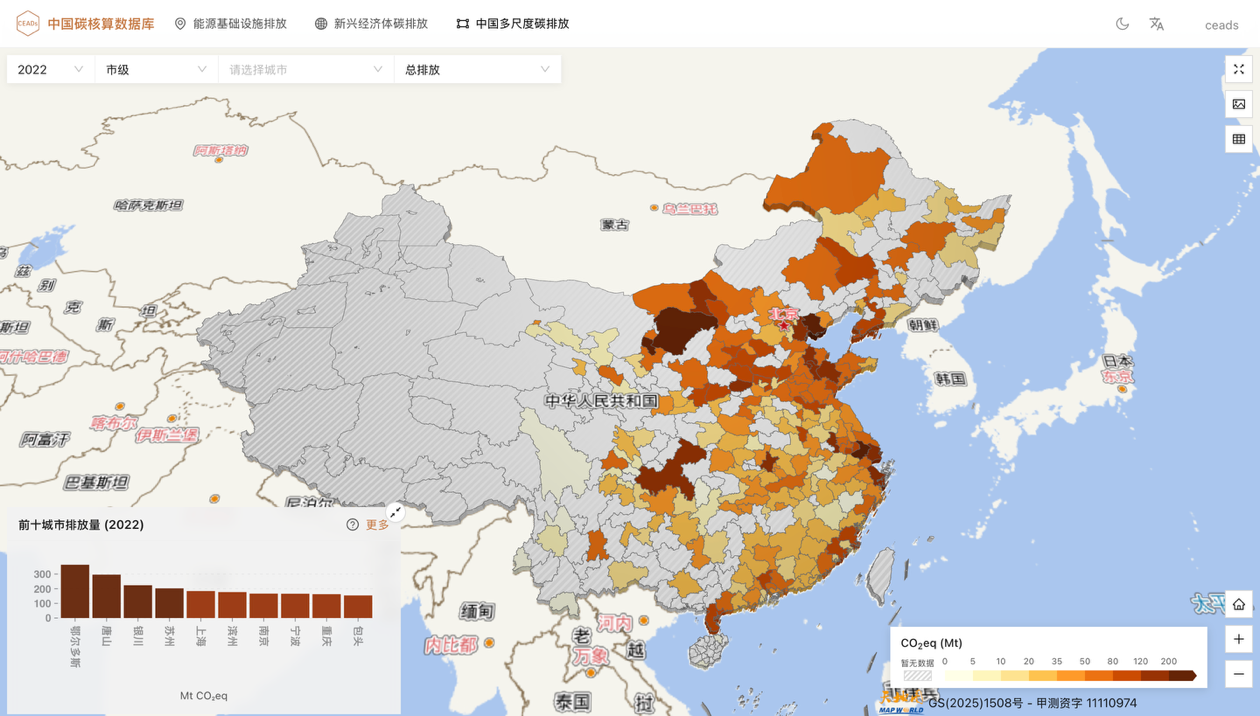
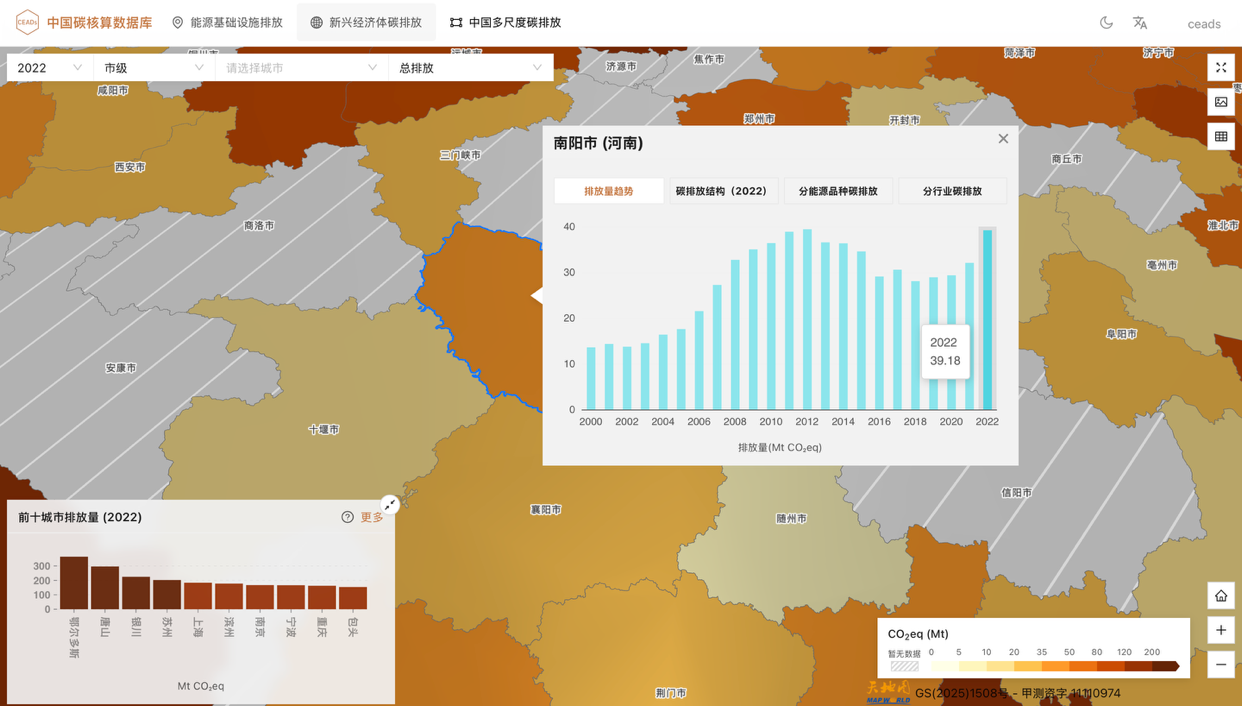
A new data visualization section improves open services for carbon emissions data:The new website places particular emphasis on the data visualization section, which presents three core CEADs datasets and links them with existing tabular data and research reports. First, the Global Energy Infrastructure Carbon Emissions section covers carbon emissions data for key industrial infrastructure worldwide, intuitively presenting the spatial distribution and emissions characteristics of global energy and industrial infrastructure. Second, the Emerging Economies Carbon Emissions section covers sectoral and energy-specific carbon emissions inventories for more than 70 emerging economies, with data linked to CEADs emerging economies reports. Third, the China Multi-Scale Carbon Emissions section covers city-level and provincial sectoral and energy-specific carbon emissions inventories in China from 1997 to 2022, systematically showing changes in carbon emissions across regions, sectors, and energy types in China. Through interactive maps, data dashboards, and filtering tools, users can intuitively view carbon emissions characteristics across regions, sectors, and industrial facilities, improving the efficiency of data queries, comparative analysis, and visualization.
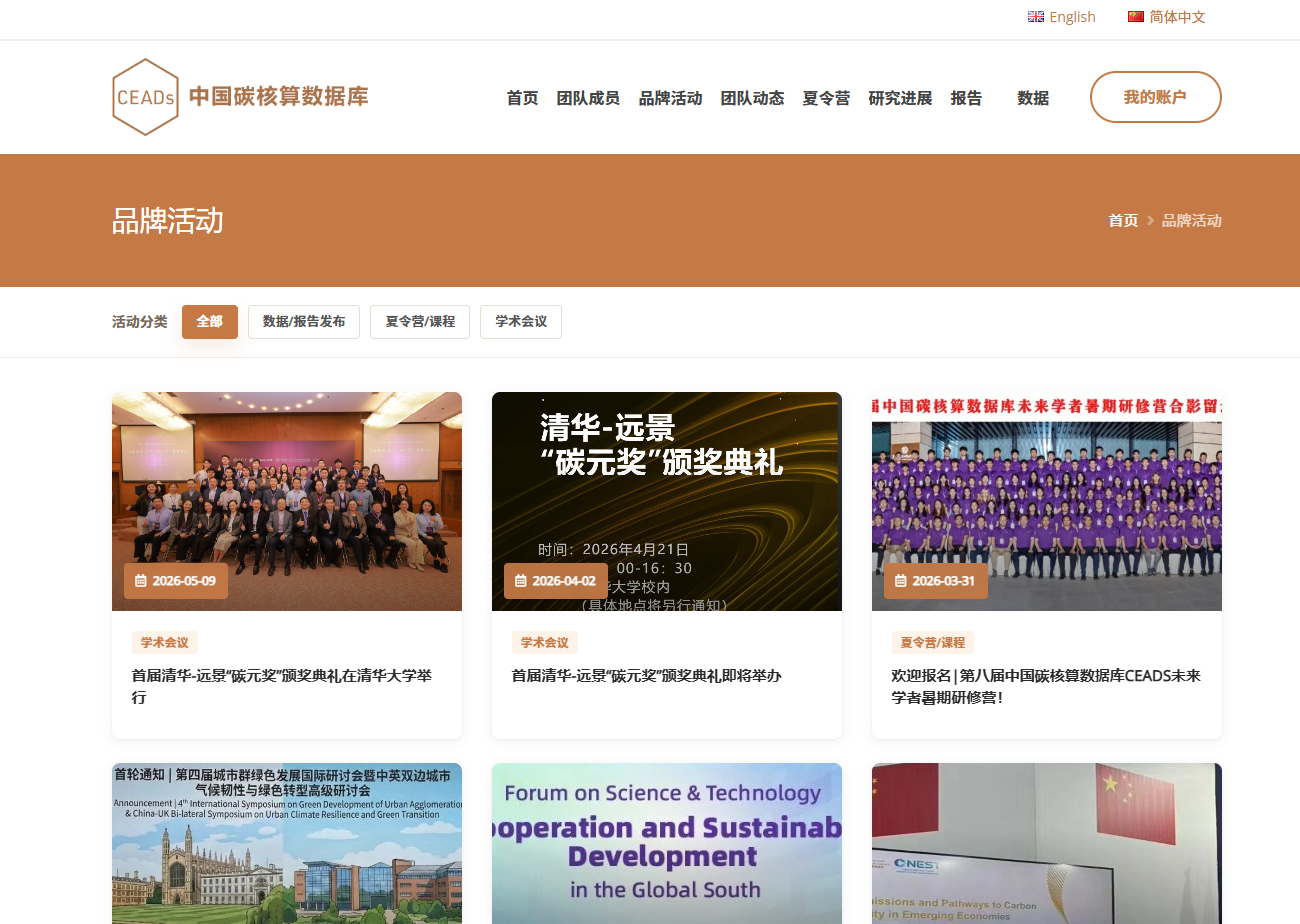
A new brand events section systematically presents CEADs academic exchange and capacity-building outcomes:The new website adds a brand events section, which chronologically reviews major activities since the establishment of the CEADs team, including data and report releases, summer schools and training courses, academic conferences, and other event types. This section will continue to be updated, presenting CEADs long-term accumulation and platform influence in data openness, capacity building, academic exchange, and international cooperation.
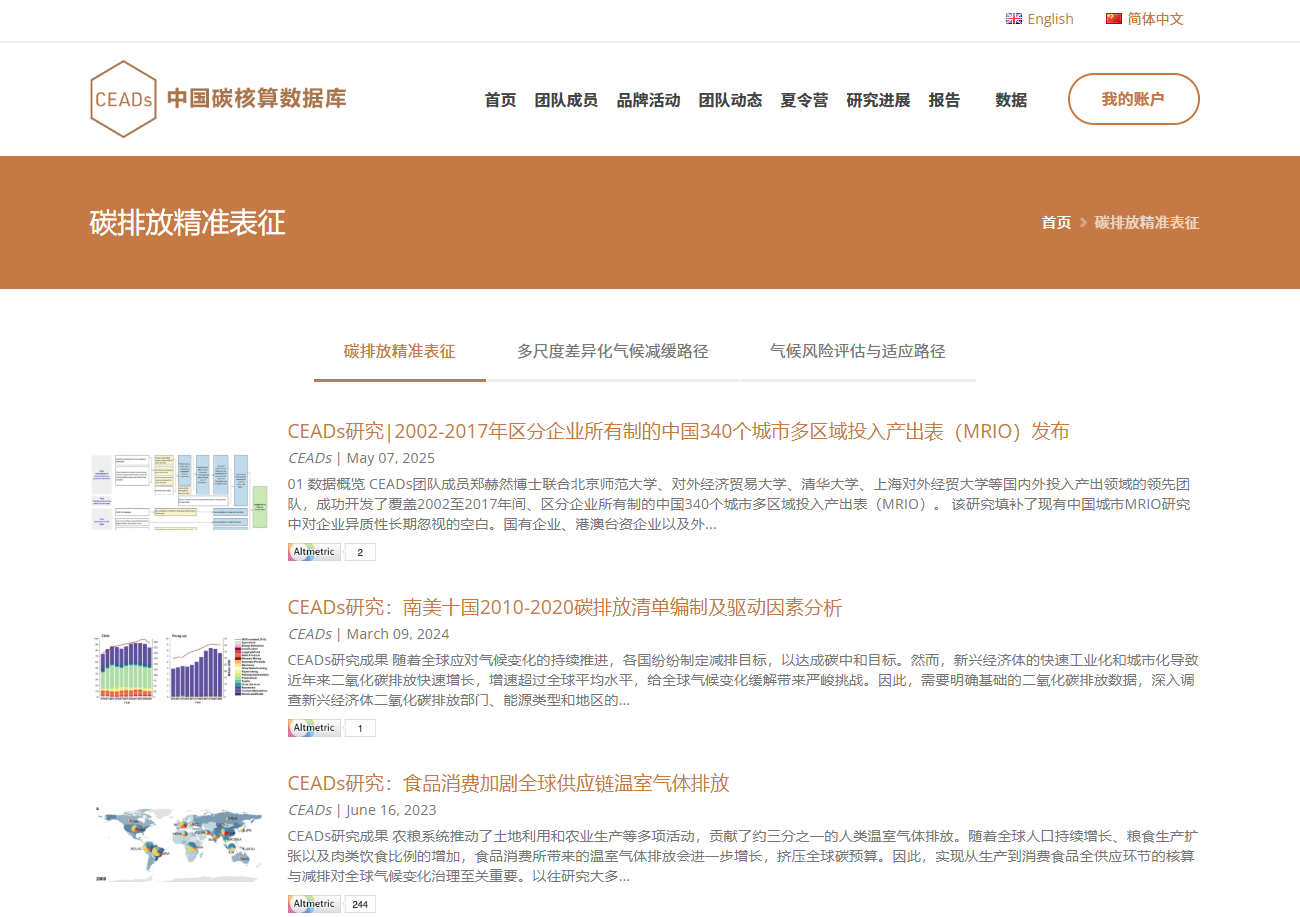
The research progress and team members sections have been updated to present the team research layout comprehensively:The research progress section has been reorganized around three major directions that the CEADs team focuses on: precise characterization of carbon emissions, multi-scale differentiated climate mitigation pathways, and climate risk assessment and adaptation pathways. It now presents the team core research context, key research directions, and latest achievements more clearly. The team members page has also updated the member list and portraits, and further improved information on members affiliated institutions and research directions, offering a more intuitive view of CEADs team composition, research division, and collaborative network.
1. Visualization Section
To promote open sharing of carbon emissions data and evidence-based decision-making, the CEADs official website has officially launched its Visualization section. Guided by the principles of openness, transparency, and interactivity, this section provides researchers, policymakers, and the public with interactive carbon emissions tools covering multiple scales and sectors. It currently presents three core datasets. Users can independently query and filter data through interactive charts, track carbon emissions trends and structural changes across regions, sectors, and industrial facilities, reduce barriers to data use and analysis, and further advance the transparency, standardization, and open sharing of carbon accounting data.
Carbon Emissions from Energy Infrastructure
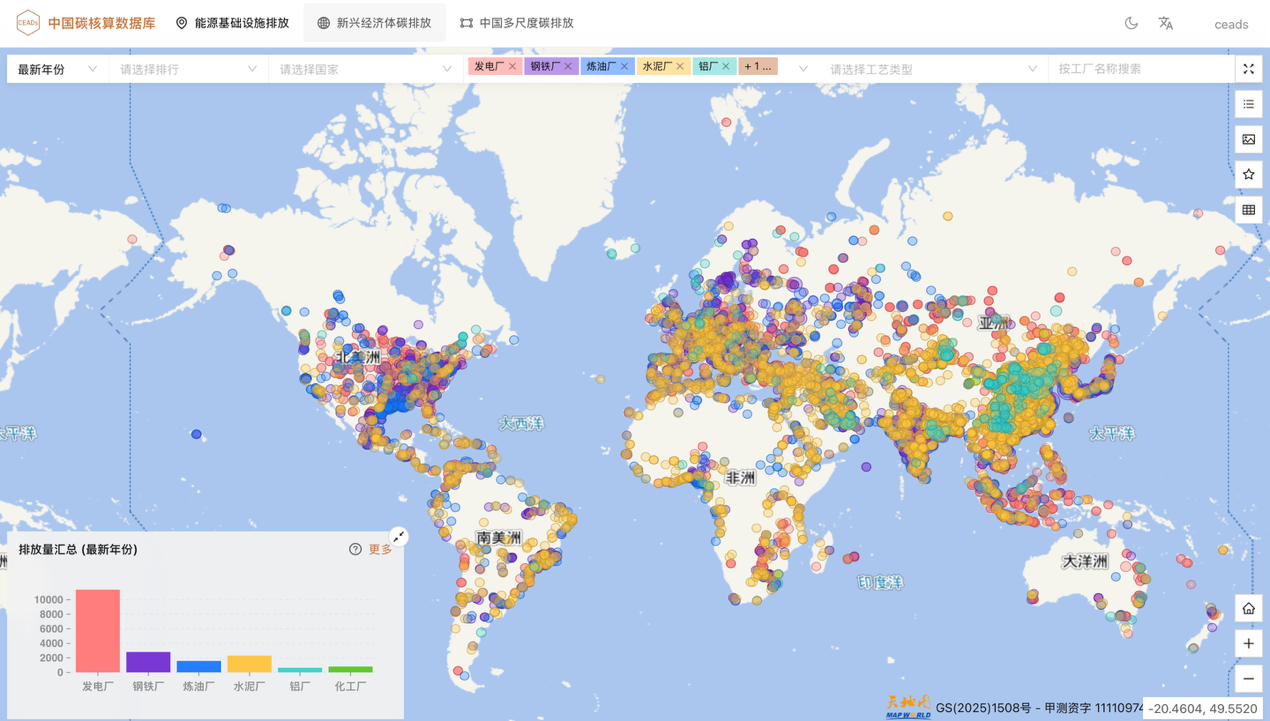
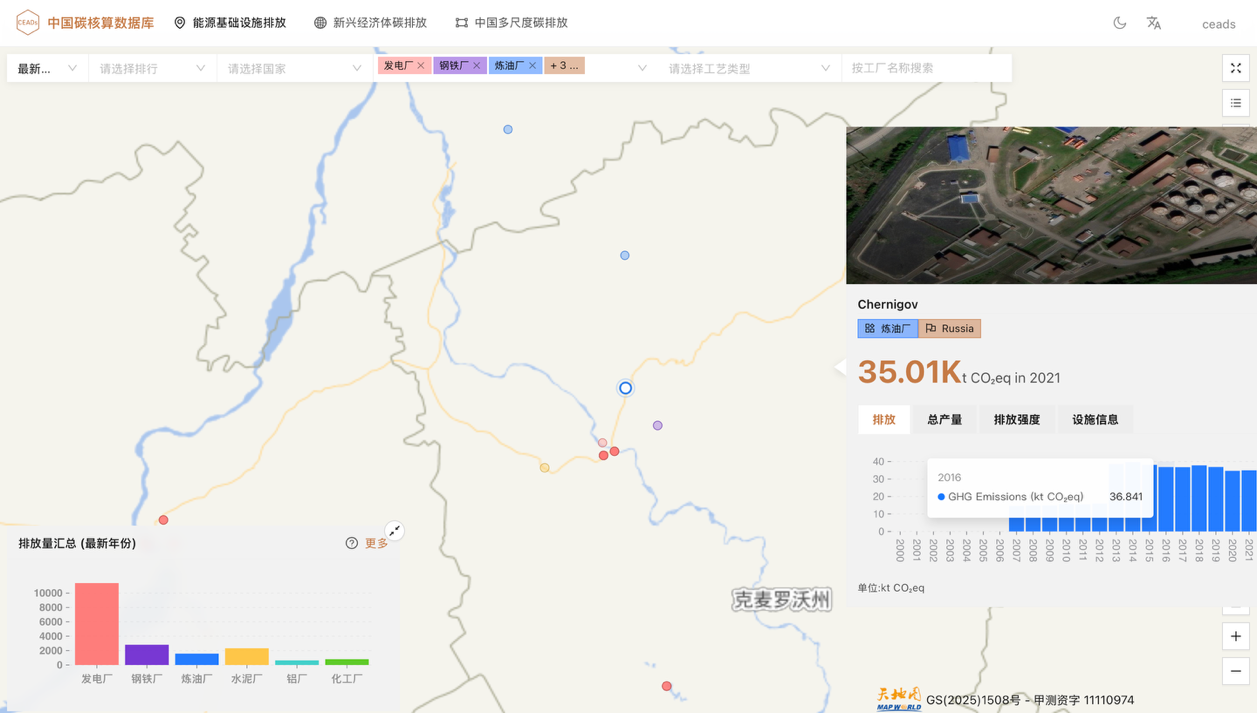
This interface integrates information on more than 23,000 key industrial infrastructure sites worldwide across high-energy-consuming industries such as steel, cement, refining, aluminum, chemicals, and thermal power. Through map-based visualization, it intuitively displays the spatial distribution and carbon emissions status of major global energy and industrial infrastructure. Users can view carbon emissions and related attributes for individual industrial facilities on the map. Data fields include plant type, process type, owning company, emissions, output, emissions intensity, and other key indicators. It also supports flexible filtering by sector, region, process type, and year, and links to carbon emissions dashboards, emissions summary results, and lists of major emission sources. This provides systematic support for identifying, monitoring, analyzing, and managing carbon emissions from key global energy infrastructure, and helps improve the precision of emission-source location and mitigation decision-making in high-energy-consuming industries.
Carbon Emissions in Emerging Economies
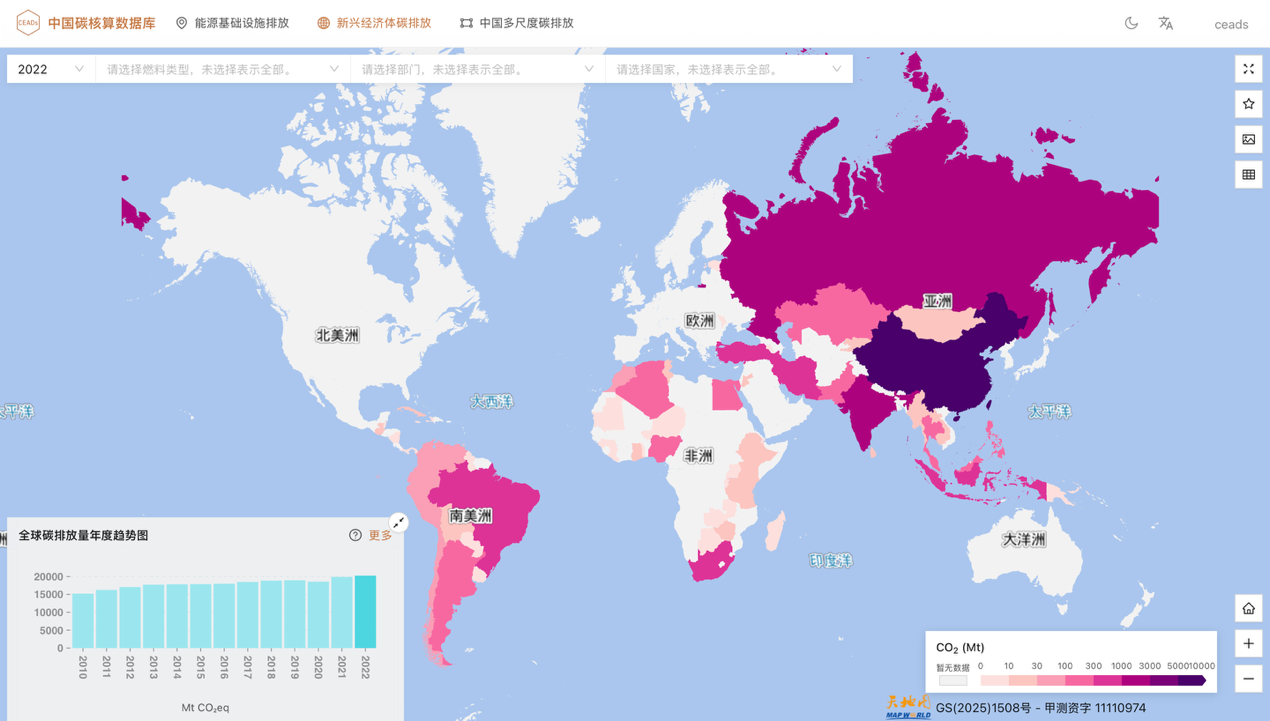
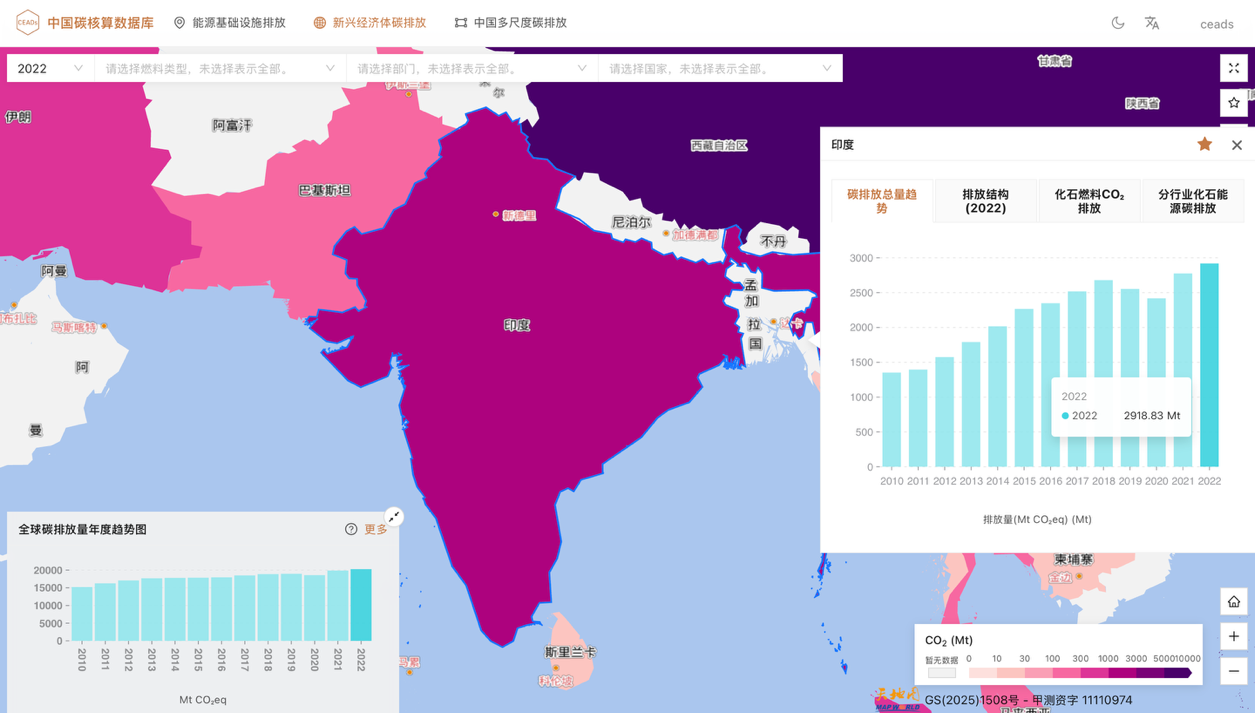
This interface focuses on fossil energy consumption and carbon dioxide emissions at the national level, bringing together multi-sector, energy-disaggregated carbon emissions inventories for more than 70 emerging economies from 2010 to 2022. It highlights carbon emissions dynamics in Asia, Africa, Latin America, Oceania, and other regions, and systematically presents the spatial and temporal characteristics of fossil-energy carbon emissions as well as the contributions of different sectors. Users can filter by sector, energy type, year, and other dimensions, and can simultaneously view carbon emissions dashboards, emissions summary results, and lists of major emission sources, providing a comprehensive data foundation for research on low-carbon development pathways in emerging economies and for global climate action.
China Multi-Scale Carbon Emissions
This interface covers carbon dioxide emissions at national, provincial, and city levels since 1997, including emissions from energy activities and cement production processes, and includes detailed data for 17 sectors and 11 energy types. It uses maps to show the spatial and temporal evolution of carbon emissions in China. It also provides per capita emissions and emissions intensity indicators at different scales, reflecting differences in emissions levels and efficiency across regions. Users can filter and analyze data by spatial scale, sector, energy type, year, and other dimensions, and view carbon emissions characteristics, energy structure, and major emission sources across regions. This provides foundational data support for regional collaborative emissions reduction, low-carbon transition, and research on China dual carbon goals.
2. Brand Events Section
To help visitors keep up with CEADs academic activities, achievement releases, and brand events, the CEADs official website has officially launched the new Brand Events section. This section systematically reviews major activities since the establishment of the CEADs team, with clear categories for convenient browsing. It includes three categories: Academic Conferences, Summer Schools/Courses, and Data/Report Releases. Visitors can access information about CEADs collaborations with universities and organizations, as well as other activities, in one place, presenting the team long-term accumulation in data openness, capacity building, and academic exchange. In the future, CEADs online and offline brand events, research report releases, course training, academic conferences, and related content will continue to be updated in this section. Scholars and industry partners are welcome to visit and follow the latest developments in carbon accounting and climate governance.
3. Research Progress Updates Section
To improve the efficiency of access to academic information, the CEADs official website recently carried out a systematic reorganization of the Research Progress section. The content framework has been reconstructed around three core directions: precise characterization of carbon emissions, multi-scale differentiated climate mitigation pathways, and climate risk assessment and adaptation pathways. Precise characterization of carbon emissions focuses on high-resolution inventories based on multi-region input-output tables and multi-source data integration; multi-scale differentiated climate mitigation pathways focuses on differences in emission reduction strategies from local to global levels; and climate risk assessment and adaptation pathways is dedicated to quantifying the impacts of extreme climate events and planning adaptation. Through this update, the Research Progress section will present CEADs core papers, data outputs, and research reports in a clearer framework, helping researchers, policymakers, and the public quickly understand the team research context and interdisciplinary achievements, providing references for carbon accounting, climate mitigation, and climate adaptation research, and jointly advancing science-based decision-making in carbon accounting and climate governance.
4. Team Members Updates Section
To improve academic transparency and collaboration efficiency, the CEADs official website has completed an information update for the Team Members section.
The updated page presents members by research direction, covering carbon emissions characterization, economy and trade, mitigation technologies and pathways, disaster footprints, and other interdisciplinary fields. This helps visitors quickly understand the research expertise and collaboration directions of relevant scholars. The update also adds several young researchers who continue to work on energy economics, climate modeling, global supply-chain emissions accounting, and related fields, reflecting CEADs continued investment in interdisciplinary collaboration and talent development.
In the future, CEADs will continue to rely on its open data platform and interdisciplinary research team to promote cross-field collaboration in carbon emissions accounting, climate mitigation pathways, climate risk assessment, and related areas, providing stronger data and research support for global climate governance and low-carbon transition.

For more information, please visit:
Chinese version | https://www.ceads.net.cn/
English version | https://www.ceads.net/